

Every minute spent checking in a visitor adds to reception workload. In the UAE, calculating cost of visitor processing time means multiplying annual visitor volume by the average minutes spent on each check-in, dividing by 60, then multiplying by the staff hourly rate in AED. The result estimates the annual labour cost of the process.
That figure puts a familiar concern into practical terms: manual check-ins can take staff away from other reception tasks, but the impact depends on visitor volume and the time each case takes. Time saved is only part of the picture. Case volume and efficiency indicators also show whether workload is changing.
This article explains how to measure processing time, estimate annual check-in time savings, and use case volume and efficiency KPIs to assess reception demand. It also shows how digital visitor management can streamline check-ins and make performance easier to understand.
Key Takeaways
- Define which check-in steps you’re measuring so processing times reflect the full reception task, including exceptions.
- Use annual visitor volume and observed time differences to estimate potential staff-hour savings.
- Break down case volume and time per case to spot when demand, rather than slow processing alone, drives workload.
- Track a small set of operational KPIs to identify bottlenecks and assess whether a streamlined process is improving reception flow.
Measuring visitor processing time and reception workload
Organizations can reduce check-in time without weakening security or privacy by collecting details in advance and applying identity checks consistently. Collect only the information needed for entry, and limit record access to staff who need it.
Visitor Processing Time Measurement
Visitor processing time is the staff time spent handling an arrival, from the first check-in action to the entry decision. Measuring it shows where reception effort goes and gives each step a clear time estimate. Use consistent start and stop points, such as opening a visitor record and completing the entry decision.
Separate active handling from queue waiting. Record exceptions too, including an unreachable host or a passport detail that needs clarification. Such cases can take longer than routine arrivals, so a single average may hide delays. Compare similar visits, such as scheduled guests with scheduled guests, rather than combining them with deliveries or unplanned arrivals.
For each observed visit, note the task, staff time, and outcome. Apply the same measurement method across reception shifts. A process map can show whether time goes to data entry, identity checks, host contact, or directions. This detail makes the estimate more useful than one overall duration.
Reception Workload Assessment
Reception workload is the staff effort needed to handle arrivals and related tasks during a defined period. Assessing it helps distinguish busy periods from slow steps in check-in. Group work by task, such as registering a guest, contacting a host, or resolving an entry exception. Then consider how these tasks compete with other reception duties.
Review arrival patterns as well as total activity. A steady stream of visitors creates a different workload from a short rush before a meeting. Note when staff handle several arrivals at once and whether each case needs the same checks. This context can explain why a shift feels overloaded even when the total count seems manageable.
Include work before and after arrival, such as reviewing submitted details or closing a visitor record. Track these separately from face-to-face check-in so their contribution remains visible. Link each task to the staff role completing it, then look for duplicated data entry or repeated host follow-ups. This gives a clearer picture of reception demand without treating every visitor case as identical.
Calculating annual visitor check-in time savings
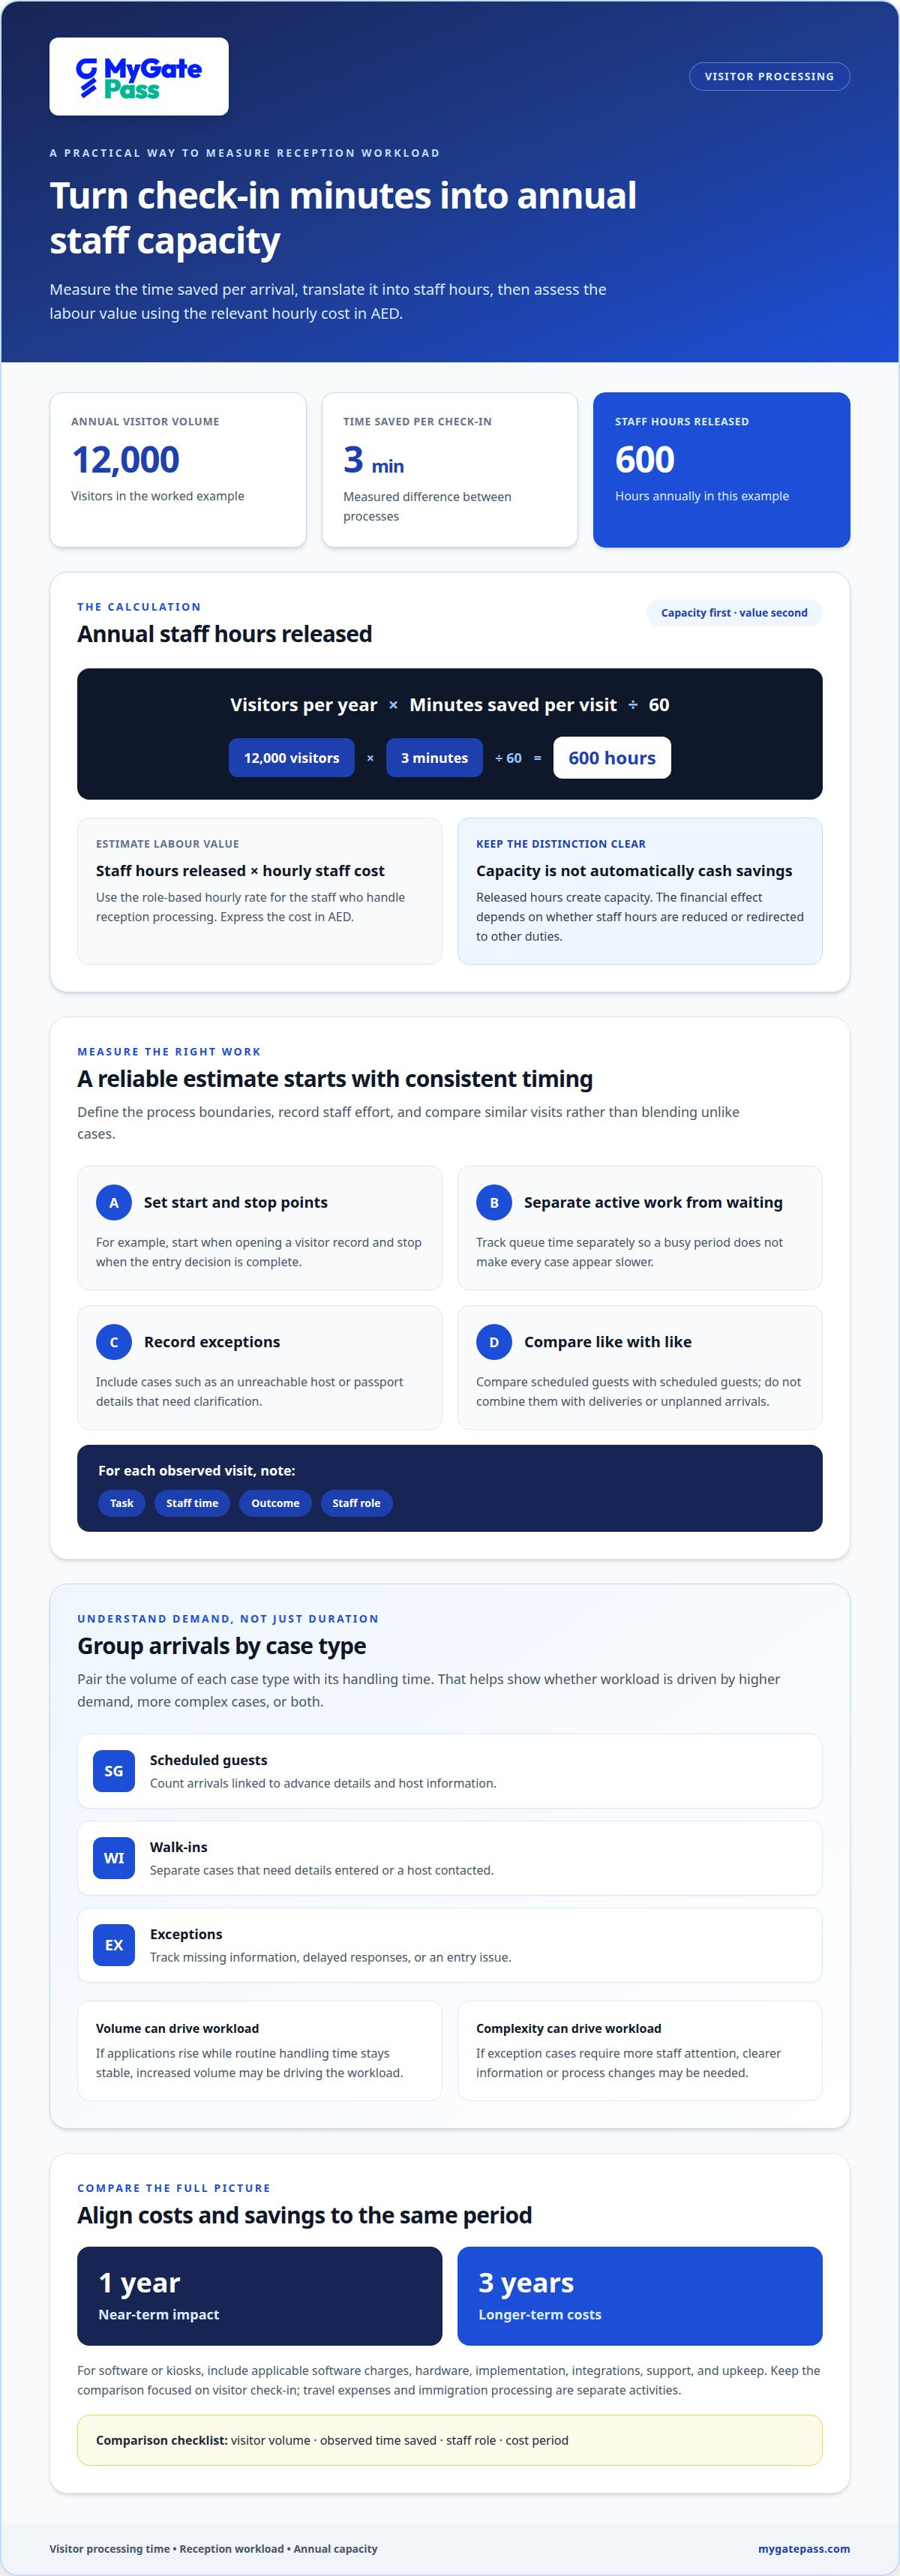
Annual time savings begin with a measured difference between the current check-in process and the proposed one. Multiply annual visitor volume by minutes saved per visit, then divide by 60 to calculate staff hours released. Multiply those hours by the relevant hourly staff cost in AED to estimate labour value. This separates time capacity from its monetary value.
Annual staff hours released = visitors per year × minutes saved per visit ÷ 60. For example, 12,000 visitors with three minutes saved per check-in equals 600 staff hours annually. To estimate labour value, multiply those hours by the organization’s hourly staff cost. Use the same role-based rate that reflects who handles reception processing.
For software or kiosks, calculate total cost over the same period as the expected savings. Include applicable software charges, hardware, implementation, integrations, support, and upkeep. Compare like with like: a one-year view shows near-term impact, while a three-year view captures longer-term costs. Any price depends on the case and is given after a quote request; relevant factors include the chosen setup, devices, integrations, and support scope.
Keep the comparison focused on visitor check-in. Travel expenses and immigration processing are separate activities, so including them in reception savings can distort the estimate. Distinguish staff time released from cash savings: saved hours create measurable capacity, but their financial value depends on how the organization uses that capacity. Cutting scheduled reception hours has a different budget effect from redirecting staff to other duties.
For a clearer comparison, record visitor volume, observed time saved, staff role, and cost period together. Then review the same measures after a process change. A digital visitor check-in process can give reception teams a consistent workflow to assess.
Case volume and time per case
Treat each visitor arrival as a case, then group cases by the work involved. A scheduled guest with complete details may follow a different path from a walk-in whose host is unavailable. Separating these cases helps explain changing reception demand, even when total visitor numbers remain steady. Include visitor applications in the relevant group when they require staff review.
Compare volume across equivalent periods, such as one month against another, and distinguish routine arrivals from exceptions. A total can conceal a busy meeting period or repeated delays caused by incomplete information. Pair each case type with its handling time to see whether workload comes from high demand, complex cases, or both. Apply the same case definitions in every comparison.
- Scheduled guests: Count arrivals linked to advance details and host information.
- Walk-ins: Separate cases that need details entered or a host contacted.
- Exceptions: Track cases with missing information, delayed responses, or an entry issue.
Time per case should reflect staff effort, not simply how long a visitor spends at reception. A guest may wait while staff handle another arrival. Record queue time separately from active processing, so a busy period does not make every case appear slower. If two staff members share a case, count their combined effort, not just the final interaction.
Use the case breakdown to interpret changes. If applications rise while routine handling time stays stable, volume may be driving the workload. If exception cases require more staff attention, the process may need clearer information or fewer repeated steps. Compare case mix with overall volume to give facility managers a sounder basis for planning reception coverage and deciding which parts of the arrival process need attention.
Operational efficiency KPIs
Operational KPIs show whether reception is becoming more efficient, not merely busier or quieter. Track measures consistently and interpret them alongside visitor volume and case mix.
Arrival Patterns and Queue Effects
Arrival patterns show when visitors reach reception and how demand clusters throughout the day. A rush of guests can create queues, increasing waiting and staff coordination even when each check-in takes the same time. This raises workload during peak periods and can make average processing time misleading.
Compare busy periods with quieter ones, separating waiting from active staff work. For example, an office receiving several scheduled visitors together may need to coordinate host notifications alongside check-ins. This distinction shows whether costs come from processing effort, queue pressure, or both.
Processing Time and Cost Benchmarks
A benchmark is a consistent reference point for judging processing time or cost. An organization’s own baseline is useful when cases, staffing, and measurement methods match. Compare routine cases with routine cases rather than treating a student visitor and a complex exception as equivalent.
There is no single time or AED cost that fits every reception. Establish an internal baseline, then monitor changes using the same case definitions. A process calculator may estimate the automatable share within a range of ±10 percentage points. It assumes errors become 80% less frequent in the automated portion, so treat that as a model assumption.
Use a focused set of KPIs to connect efficiency with service quality:
- Average active handling time: compare like-for-like visitor cases.
- Queue time: identify periods when arrivals outpace reception capacity.
- Exception rate: track cases requiring extra staff intervention.
- Record completion: monitor whether visitor records are closed consistently.
Choose one to three additional savings items only when measurement is reliable, such as audit preparation or error reduction. Review results at 30, 60, and 90 days after implementation, then interpret changes alongside arrival patterns. To streamline visitor workflows and track operational performance, explore visitor management options.
MyGatePass: MyGatePass Visitor App
The MyGatePass Visitor App supports digital visitor management when manual check-ins make reception workload harder to manage. It is part of a connected setup that includes the MyGatePass Security App for security personnel and the MyGatePass Admin Dashboard for centralized administration.
For UAE organizations that need verified visitor identification, the UAE Pass Integration Module connects the visitor process with UAE Pass. Together, these tools support a clearer digital workflow, helping teams assess case volume and operational efficiency alongside check-in time.
Contact MyGatePass to discuss your visitor management needs.
Make the next reception improvement measurable
Use your findings to guide a practical improvement, not just produce another report. When calculating the cost of visitor processing time, connect the numbers to the experience you want guests and reception teams to have: clear arrival steps, consistent checks, and fewer avoidable handoffs. Set a baseline and use it to inform future operational decisions.
MyGatePass brings visitor workflows together through the MyGatePass Visitor App, MyGatePass Security App, and MyGatePass Admin Dashboard. These tools support a more organized approach to visitor information and reception activity, while giving your team a clearer operational picture.
Start a conversation about the visitor processing challenges your organization wants to address. Contact MyGatePass to discuss visitor processing and explore a more streamlined approach for your facility.
Small process improvements can make arrivals feel more considered. Build on your measurements to keep improving the visitor experience.
Frequently Asked Questions
Process cost calculator: what does a manual process cost?
Manual process cost is the staff time spent completing tasks, valued at the relevant labour rate, plus attributable operating costs. For visitor processing, include work such as recording details, contacting a host, and resolving exceptions. Separate one-off expenses from recurring overhead. This helps a calculator show which costs arise from each visitor case and which support the wider reception operation.
How do you calculate the cost of visitor processing time?
For annual labour cost, multiply visitors processed in a year by average staff minutes per visitor, divide by 60, then multiply by the hourly labour cost in AED. For example, calculate each visitor category separately if scheduled guests and walk-ins require different handling. This approach to calculating the cost of visitor processing time makes the assumptions visible and easier to update when volumes change.
What formula calculates visitor processing labor cost per visit?
Use this formula: staff minutes per visit ÷ 60 × hourly staff cost in AED = labour cost per visit. If more than one staff member works on the same case, add their task time before converting minutes into hours. For example, count the receptionist’s registration time and any separate staff member’s host coordination time, rather than treating the case as one person’s effort.
Which staff costs and overhead should be included in visitor processing costs?
Include the labour cost of staff who perform visitor-related tasks, using the hourly cost relevant to each role. Add overhead only when it can reasonably be allocated to the process, such as reception administration or systems used for visitor records. Exclude unrelated facility expenses. A consistent allocation method helps prevent counting the same overhead twice.
How do you measure average visitor processing time accurately?
Use consistent start and finish points for each observation, and record active staff handling separately from visitor waiting. Log routine arrivals and exceptions as distinct case types, since a host delay or incomplete details changes the work involved. Review records for missing timestamps and unusual cases before calculating averages. This gives a more useful measure than timing only the quickest check-ins.
What is the cost comparison between manual and automated visitor processing?
Compare both approaches over the same period, using the same visitor volume, case types, and staff-cost assumptions. Include relevant implementation and ongoing system costs alongside manual labour and allocated overhead. Compare the total with measurable benefits, such as staff time released or fewer repeated tasks. Keep capacity savings separate from cash savings, because redirected staff time does not automatically reduce a budget.


